
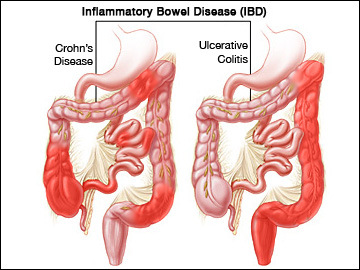
In this post I will be applying machine/deep learning methods to a dataset from one of the largest Inflammatory bowel disease (IBD) microbiome study in humans.
Copyright Declaration
Unless otherwise stated, the author asserts his copyright over this file and all files written by him containing links to this copyright declaration under the terms of the copyright laws in force in the country you are reading this work in.
This work is copyright © Ali A. Faruqi 2016. All rights reserved.
1. Background
In my previous posts, I applied different machine learning algorithms to a specific microbiome dataset for HIV prediction. The dataset was quite small and had information of only 51 subjects. The next logical step, in my journey of applied machine-learning for disease detection, was to obtain a larger microbiome dataset.
This I did by getting hold of the files from the study by Gevers et al. The study by Gevers et al. is one of the largest microbiome studies in pediatric inflammatory bowel diseases (IBD) area. Amongst other things, the study explored the role of biopsy-associated microbiome for diagnosis of Crohn’s disease (CD).
The data from this study was obtained from the QIITA website. The OTU table and meta-data file provided information about 1359 human samples, which were divided into 4 categories. 731 subjects had Crohn’s disease (CD), 219 had ulcerative colitis (UC), 73 had indeterminate colitis (IC) and 336 were healthy subjects. The OTU table additionally had information about 9511 OTUs.
To make the classification task simpler, have clear separation between health and disease status and have larger training and test datasets, I combined the UC, IC and CD samples into a single IBD category and kept healthy subjects in their separate category.
Gevers et al. had constructed ROC curves in their original paper to evaluate the performance of sparse logistic regression classier (using L1 penalization) to identify IBD status of subjects based on microbiome profile.
2. Differences from main study
In the analysis I’m posting here, I did three things differently:
-
Gevers et al. had separated the samples by collection site. To quote from the paper: ‘We included a total of 425 tissue biopsies of the ileum, 300 of the rectum, and 199 stool samples in three independent analyses.’ They had shown three separate ROC curves, each for separate sample type. In the metadata file provided for this study from the QIITA website, there were 641 ileum sample, 309 rectum samples and 283 stool samples. I could not figure out the reason for this discrepancy even after contacting QIITA support team, so I could not get to replicate the analysis by Gevers et al.
-
It was not clear from the paper whether the authors had pooled together the UC, IC and CD samples together in order to do binary logistic regression or had kept the classes separate and had performed multinomial logistic regression. As stated earlier, I opted for binary classification by grouping all UC, IC and CD samples together.
-
Gevers et al. only assessed the performance of sparse logistic regression classier (using L1 penalization). In addition to sparse logistic regression classifier with L1 penalty, I also tested the performance of Random Forest, Gradient Boosting Trees, Gaussian Naive Bayes, Support Vector Machine and Multi-layer Perceptron.
All the code for this analysis is present on Jupyter Notebooks hosted on my GitHub and can be seen here and here.
3. Results
The following table shows the accuracy of different classification algorithms on the dataset by Gevers et al.
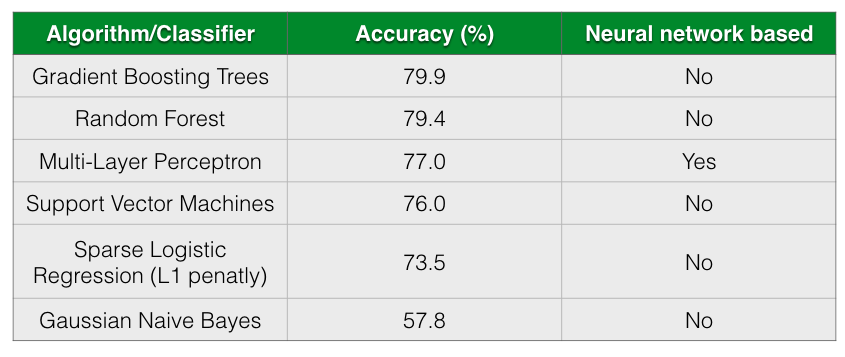
As seen from the table, all almost classifiers did better than sparse Logistic Regression with L1 penalization except for Gaussian Naive Bayes. Gradient Boosting Trees and Random Forests has almost comparable prediction accuracy followed closely by Multi-Layer Perceptron.
According to Gevers et al., the sparse logistic regression model had second best performance while predicting CD status from rectal biopsies (AUC=0.78). Even though it’s not truly an apples-to-apples comparison, we get comparable AUC with Multi-Layer Perceptron, Gradient Boosting Trees and Random Forest when predicting IBD status from any type of sample (including ileum, rectum and stool). The following figure shows the AUC results.
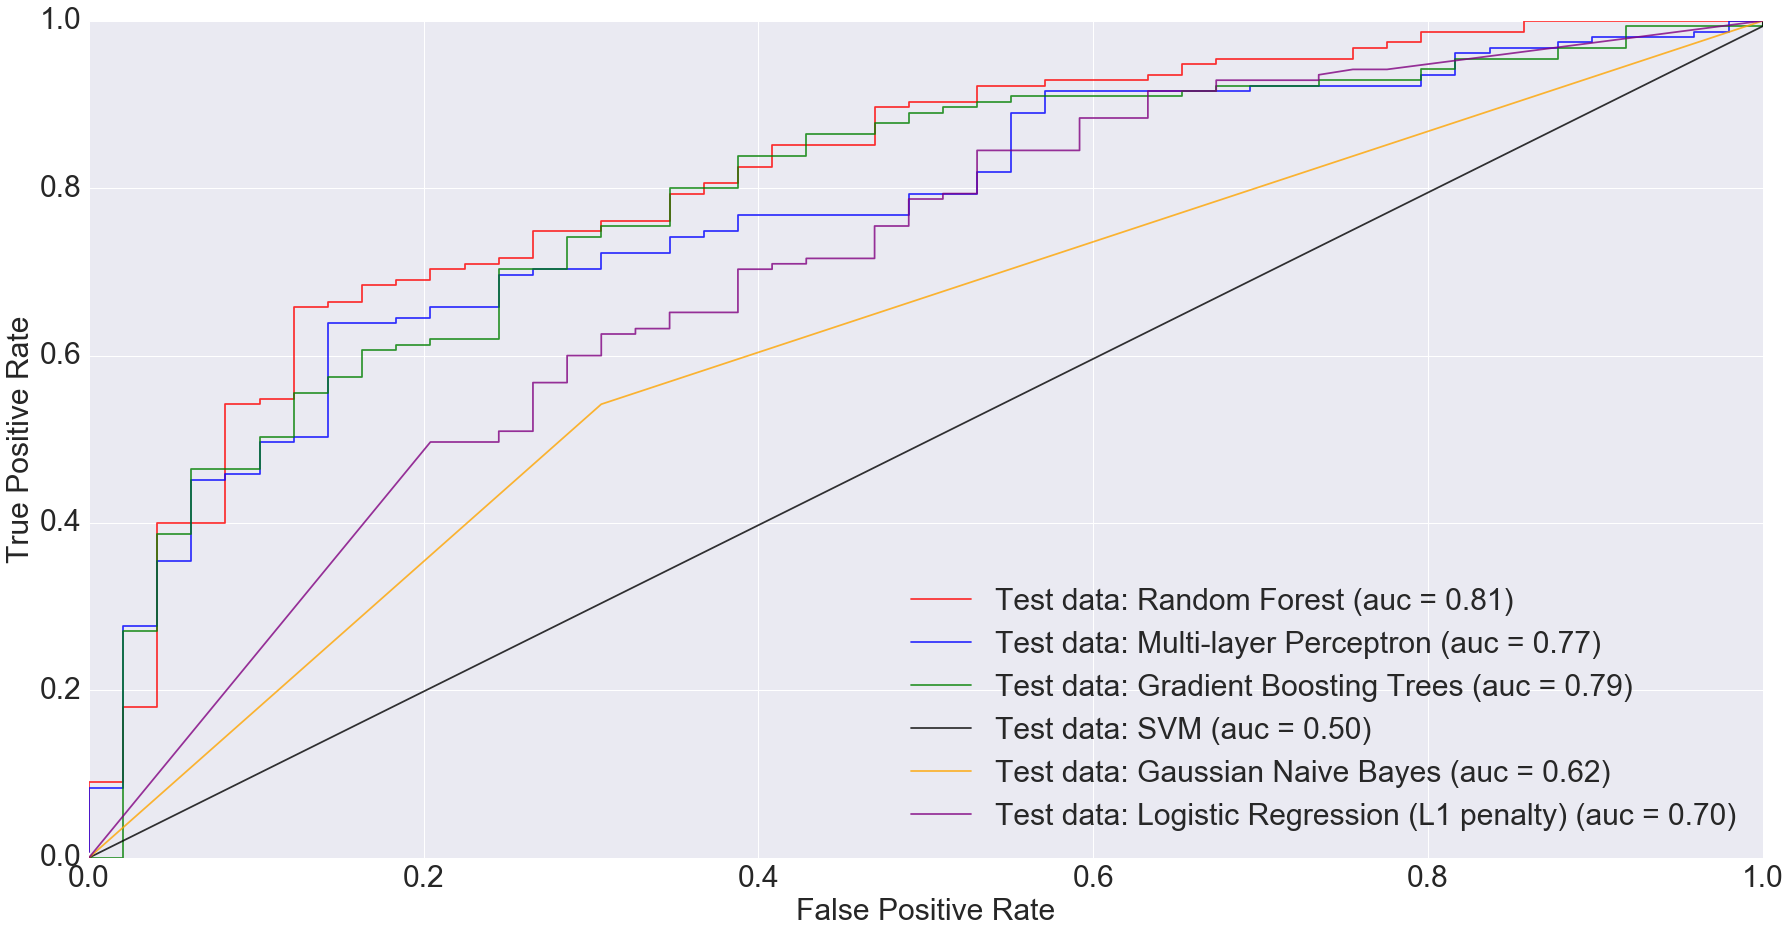
I would argue that my approach is slightly better because we are predicting disease by using different sample types. Ideally, we’d want models that can predict disease status irrespective of sample types. This is important because obtaining certain types of samples such as ileum or rectum biopsies is difficult. Procedures to obtain such samples are invasive and expensive.
Based on the results I’ve shown above, complex models such as random forests and multi-layer perceptron can do a comparable job at predicting disease status irrespective of sample type.
There is also potential in using microbiome data, as obtained from stool samples alone, to do disease diagnosis making the whole process much cheaper and non-invasive. In fact, when we filtered the dataset down to just stool samples (n=283) and trained the models on the smaller dataset, we got some very interesting results. The AUC for logistic regression with L1 penalty was 0.35: the worst among all models.
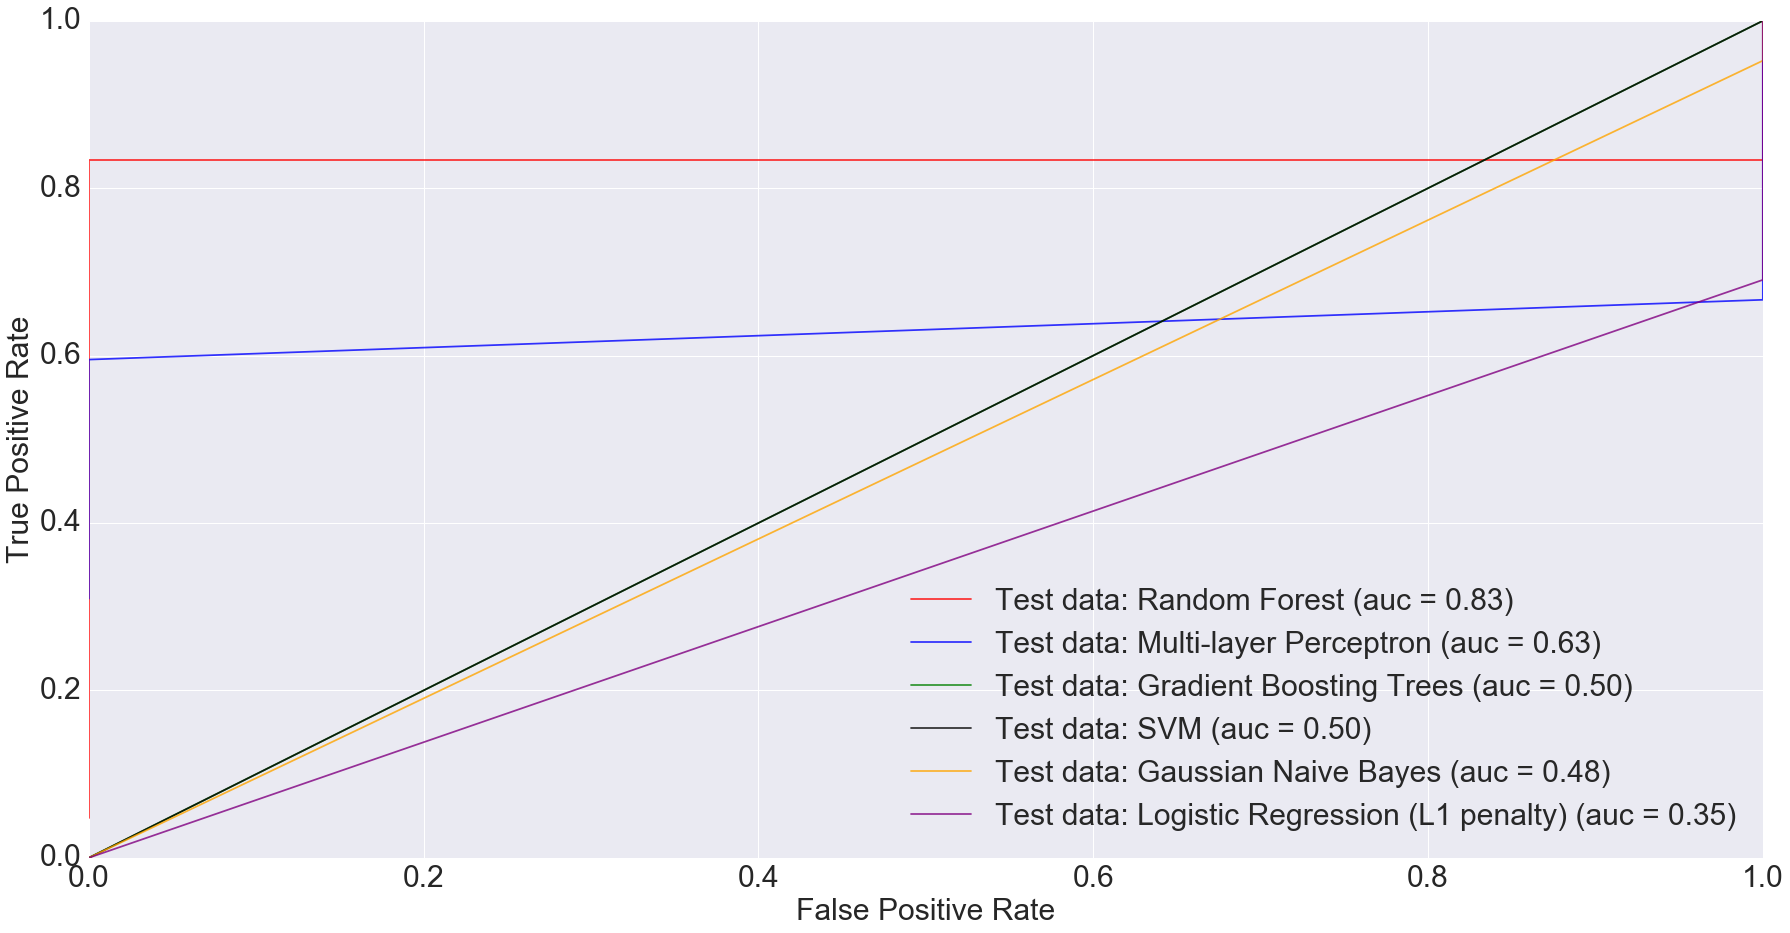
Random Forest performed the best with AUC equal to 0.83. The next best performer with Multi-Layer Perceptron with AUC equal to 0.63. This clearly indicates that more complex models have better predictive power when predicting IBD status from stool data, compared to simpler ones.
3A. Convolutional Neural Networks
CNNs, as implemented in TensorFlow, ate all my CPU. I ran the CNN on Gevers et al.’s dataset on my laptop for over 24 hours and it still didn’t finish.
Even though I was successfully able to install GPU enabled TensorFlow on my laptop, I couldn’t get it to work. The following message printed on the terminal screen:
I tensorflow/core/common_runtime/gpu/gpu_device.cc:814] Ignoring gpu device (device: 0, name: GeForce GT 650M, pci bus id: 0000:01:00.0) with Cuda compute capability 3.0. The minimum required Cuda capability is 3.5. Device mapping: no known devices.
The reason, as seen from the message, is that GPU enabled TensorFlow requires CUDA Compute Capability 3.5 to work. The GPU on my MacBook Pro is NVIDIA GeForce GT 650M, which has CUDA Compute Capability 3.0.
I hope I can get funding and/or collaborative support to access a GPU machine/cluster in order to try convolutional neural networks on the study by Gevers et al. If that happens and I am able to successfully run CNNs on Gevers et al.’s dataset, I will post that as a separate blog entry.
4. Discussion and Conclusion
As seen from this analysis, more sophisticated models have done a much better job at prediction than simpler ones. One of the reasons for this success of complex models over simpler ones probably is large sample size.
Moving forward, I will write a post that will provide some preliminary but promising results on how microbiome plus machine learning beat the state-of-the-art disease diagnosis test for an extremely important disease. Stay tuned!