
In this post I will be applying machine/deep learning methods to a microbiome dataset from a study by Baxter et al titled “Microbiota-based model improves the sensitivity of fecal immunochemical test for detecting colonic lesions”.
Copyright Declaration
Unless otherwise stated, the author asserts his copyright over this file and all files written by him containing links to this copyright declaration under the terms of the copyright laws in force in the country you are reading this work in.
This work is copyright © Ali A. Faruqi 2016. All rights reserved.
1. Background
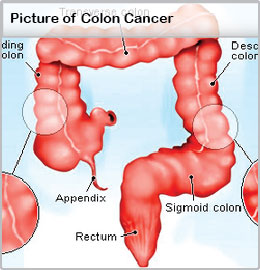
Colorectal cancer is the second leading cause of cancer related deaths in US. The gold standard methods of colorectal cancer detection includes procedures such as colonoscopy and sigmoidoscopy. The problem with procedures such as colonoscopy and sigmoidoscopy is that they are expensive and invasive. There is, therefore, a great need in developing highly sensitive, non-invasive and inexpensive tests to detect colorectal cancer early on.
A number of scientific studies have pointed towards a change in the composition of gut microbiota, as colorectal cancer progresses. This represents an opportunity to explore the development of microbiome-based diagnostics for colorectal cancer detection. Specifically, the microbiome profile of an individual, as obtained from stool sample, can be used a proxy to identify the individuals health status.
In the context of machine learning, we are presented with a supervised learning problem for classification. The microbiome profile for an individual is a vector of OTUs (features). Having a dataset of microbiome profiles of individuals with or without colorectal cancer, we can perform a training-test-split, learn on the training set, perform cross-validation and see how well the predictions do compared to the actual values of the test set.
2. Materials and Methods
A recent study by Baxter et al. published this year in April 2016 demonstrated that random forest classifier did a surprisingly well job at predicting colorectal cancer using microbiome data as input. This was a nice dataset since it had a large number of samples (490) and fewer number of OTUs (335). In this case, p < N. This meant that deep-learning methods would work as well since our feature vector was small (only 335 OTUs) as opposed to the study by Gever et al., which had 9511 OTUs.
Following the approach taken in my previous analyses, I obtained the dataset, which is publicly available on GitHub and compared other supervised learning methods to the random forest classifier used originally in the paper. The analyses I performed differed from the original study in three important ways:
-
In the original study, there were 3 clinical outcomes: normal, adenoma and cancer. The authors had constructed ROC curves for adenoma vs. normal and for cancer vs. normal. While it is fine to take such an approach, doing this way split of the data reduces sample size for training and testing. Since adenoma is a non-cancerous state, I combined all normal and adenoma samples into a single ‘no-cancer’ category and constructed ROC curves of no-cancer vs. cancer.
-
In the R code provided with the data on GitHub, it was surprising to note that training-test-split was not performed on the dataset with 490 samples. That is, the random forest classifier was trained and tested on the entire dataset. I did a train-test split.
-
The authors used R programming language for their analyses and I relied on Python.
The analyses is present on a Jupyter notebook, which can be accessed here.
3. Results
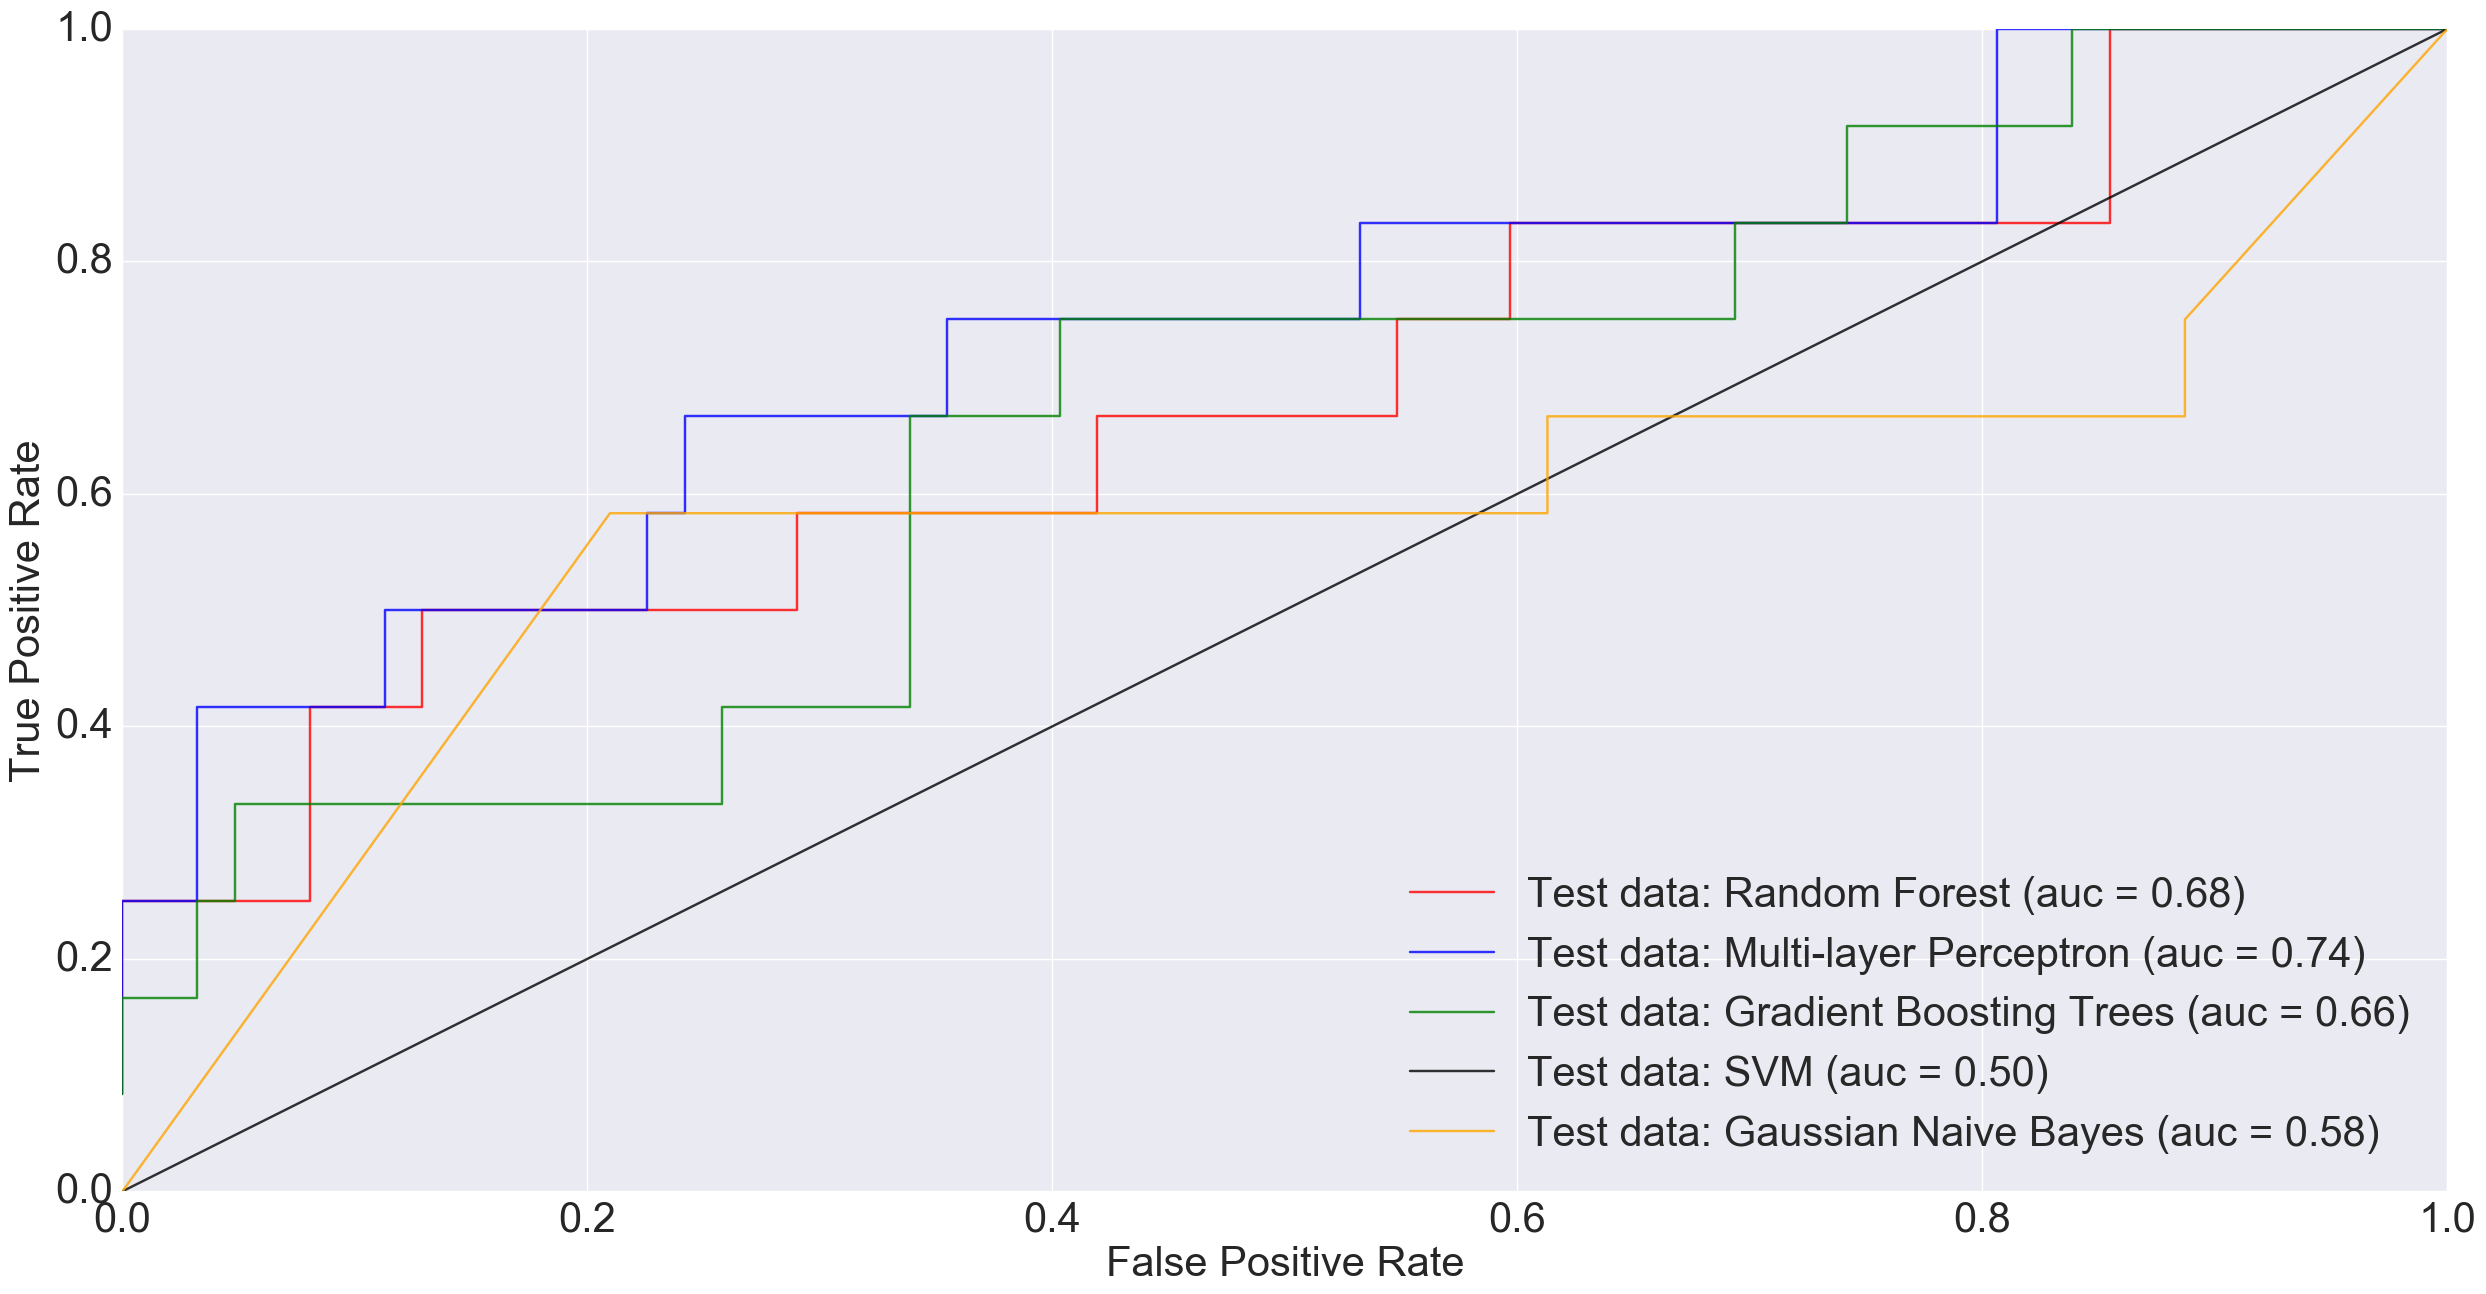
The following ROC curve shows the performance of different classification algorithms in predicting colorectal cancer status
Adenoma was in 198 samples, normal was 172 and cancer was 120. If a binary classification is performed between just the normal samples and cancer samples, our total sample size is 292 (172+120). Doing a 85% training/15% test split i.e., 248 training and 44 test, MLP performed much worse than other models and Random Forest did really well.
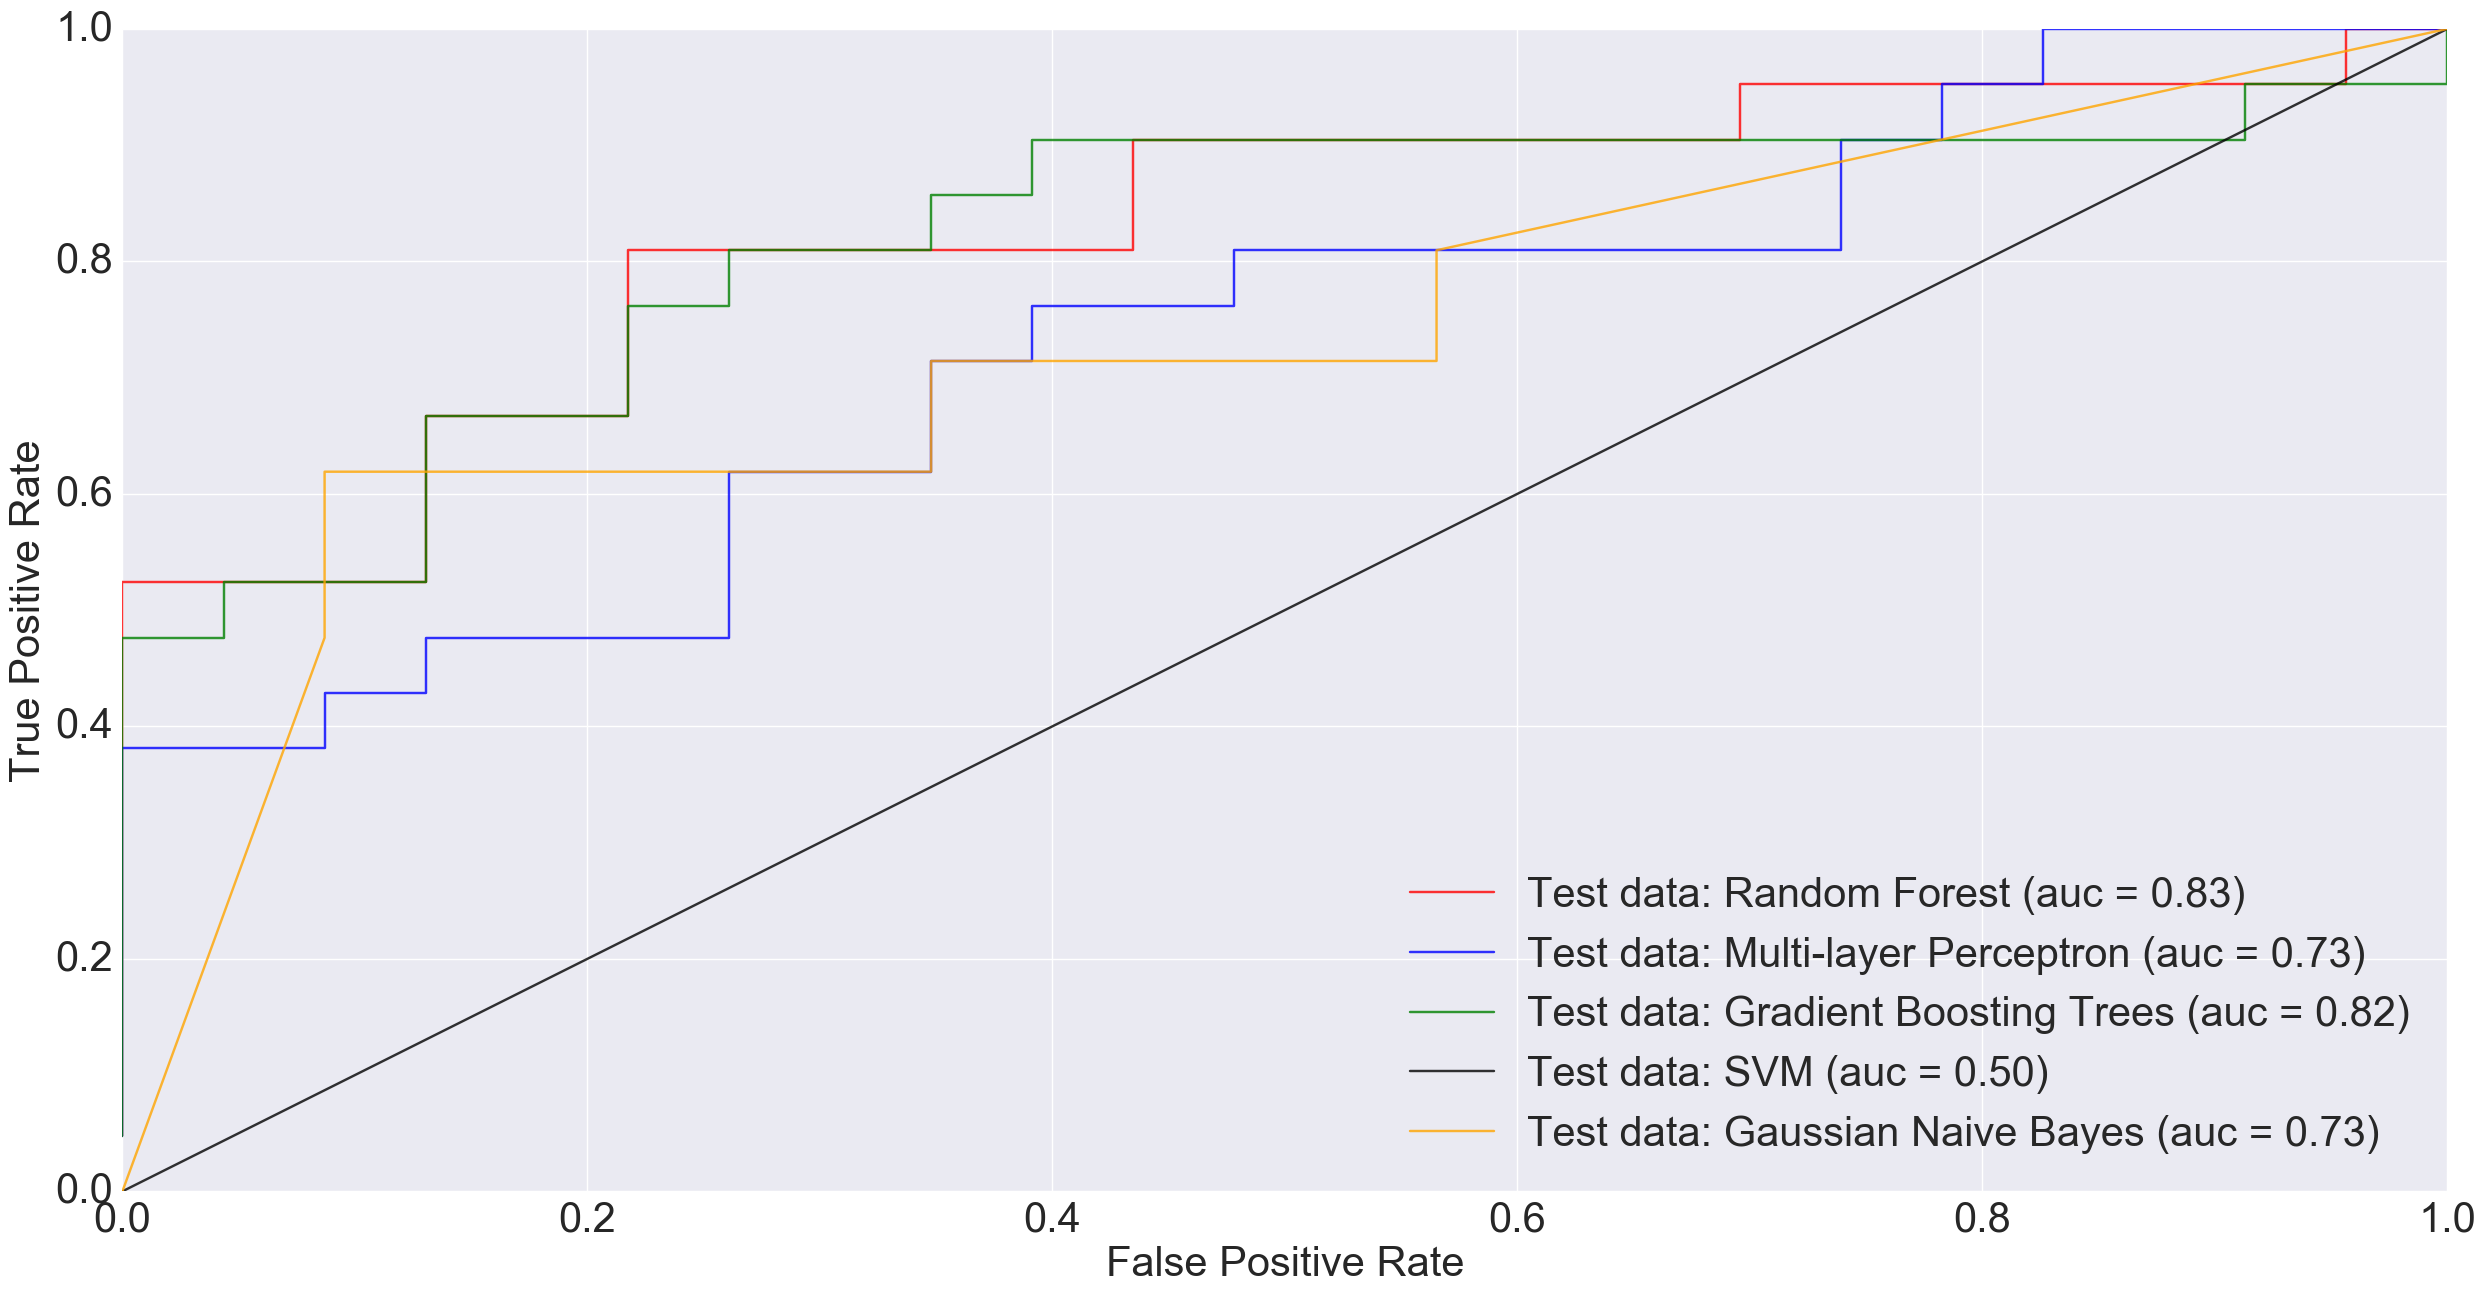
However, at larger sample sizes (416 training and 74 test), when all non-cancerous samples were combined into one group in order to benefit from the entire dataset, MLP performed much better than other models including Random Forest and Gradient Boosting Trees.
In the plot above, a simple neural net architecture has performed better than more sophisticated algorithms such as Random Forest and Gradient Boosting Trees.
4. Discussion
There is potential in using the microbiota profile as obtained through Next Generation Sequencing (NGS) technologies as proxy for diagnosing difficult diseases. While there is no one best machine learning algorithm out there to do the job, there is great potential in using deep-learning algorithms for this purpose. In future, as datasets grow and algorithms improve, we hope to reach a point where disease detection might routinely rely on machine learning approaches.
5. Acknowledgements
Thanks to Dr. Pat Schloss for pointing towards the study by Baxter et al. and answering some of my questions. Also, thanks to a suggestion by my friend, Ahmet Sinan Yavuz, to try combining all non-cancerous samples into one group before training the models.